Streamlit example
Streamlit is a open-source app framework is the easiest way to create beautiful apps
Hello world
import streamlit as st

st.title('Hello World,')
st.write("It's streamlit app")

Dropdown list
st.write("Pick up one")
keys = ['Normal','Uniform']
dist_key = st.selectbox('Which Distribution do you want?',keys)
st.write('You have chosen {}'.format(dist_key))
print(dist_key)

Tables/dataframe
df = pd.DataFrame({
  'first column': [1, 2, 3, 4],
  'second column': [10, 20, 30, 40]
})

# display table
df
Charts
# display line chart
chart_data = pd.DataFrame(
     np.random.randn(20, 3),
     columns=['a', 'b', 'c'])

st.line_chart(chart_data)

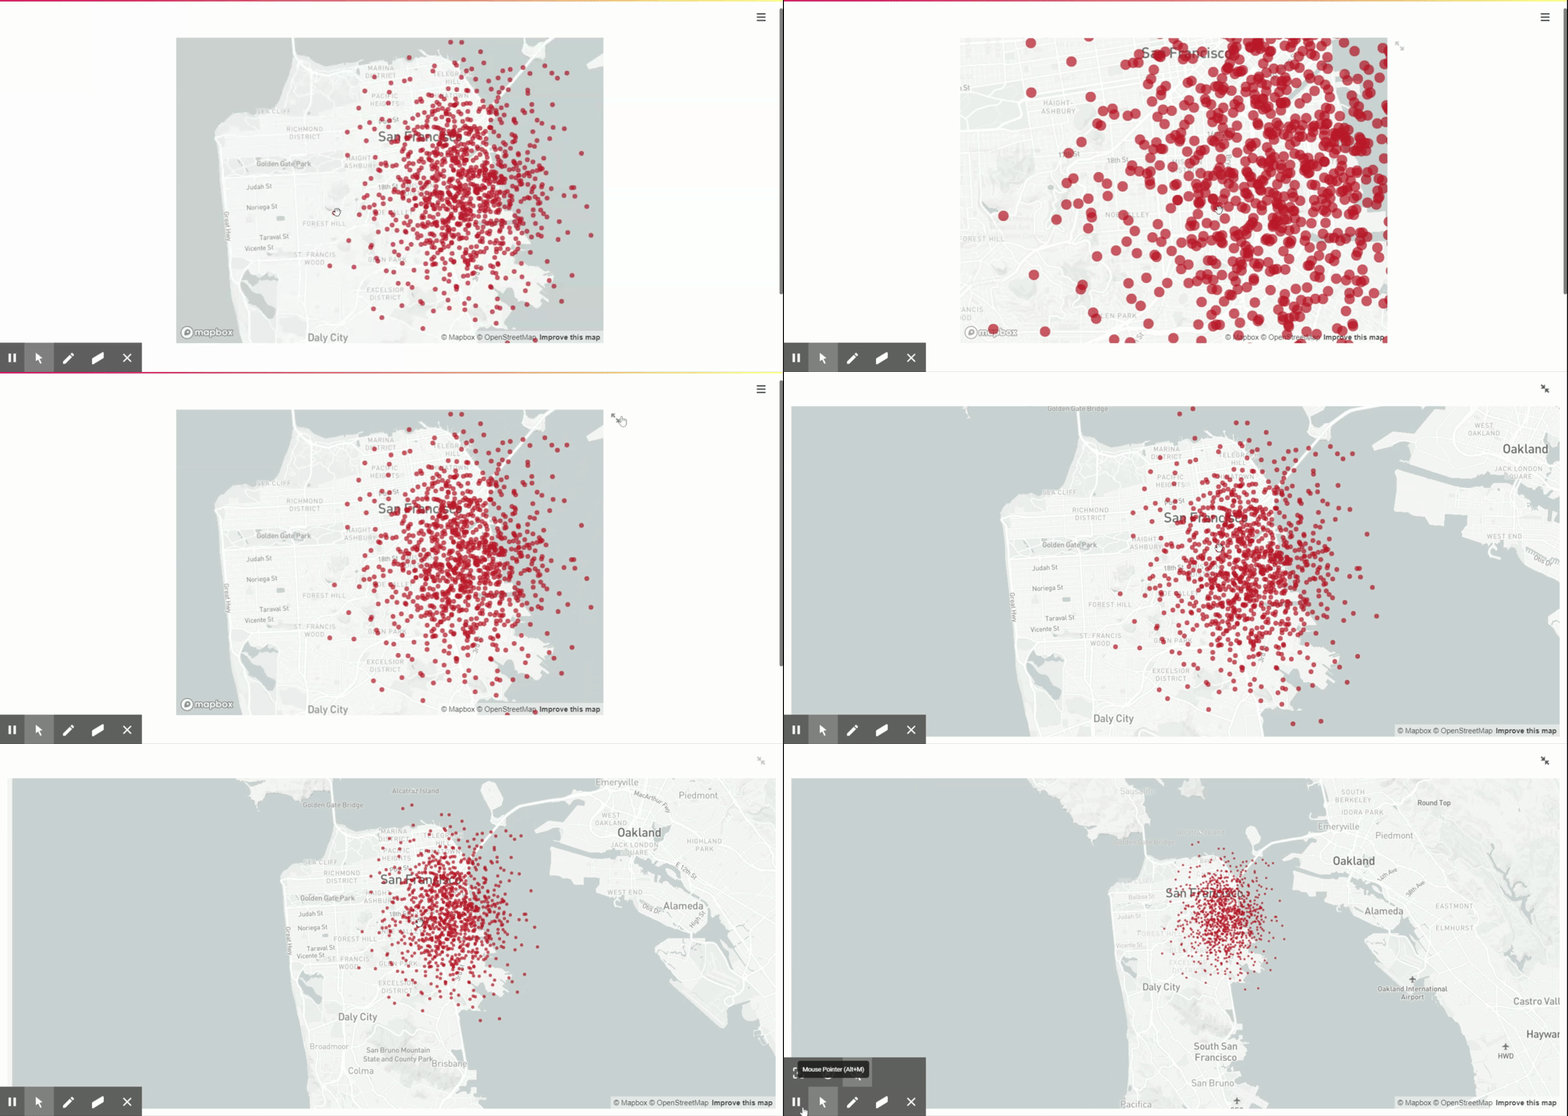
Maps
# map
map_data = pd.DataFrame(
    np.random.randn(1000, 2) / [50, 50] + [37.76, -122.4],
    columns=['lat', 'lon'])

st.map(map_data)

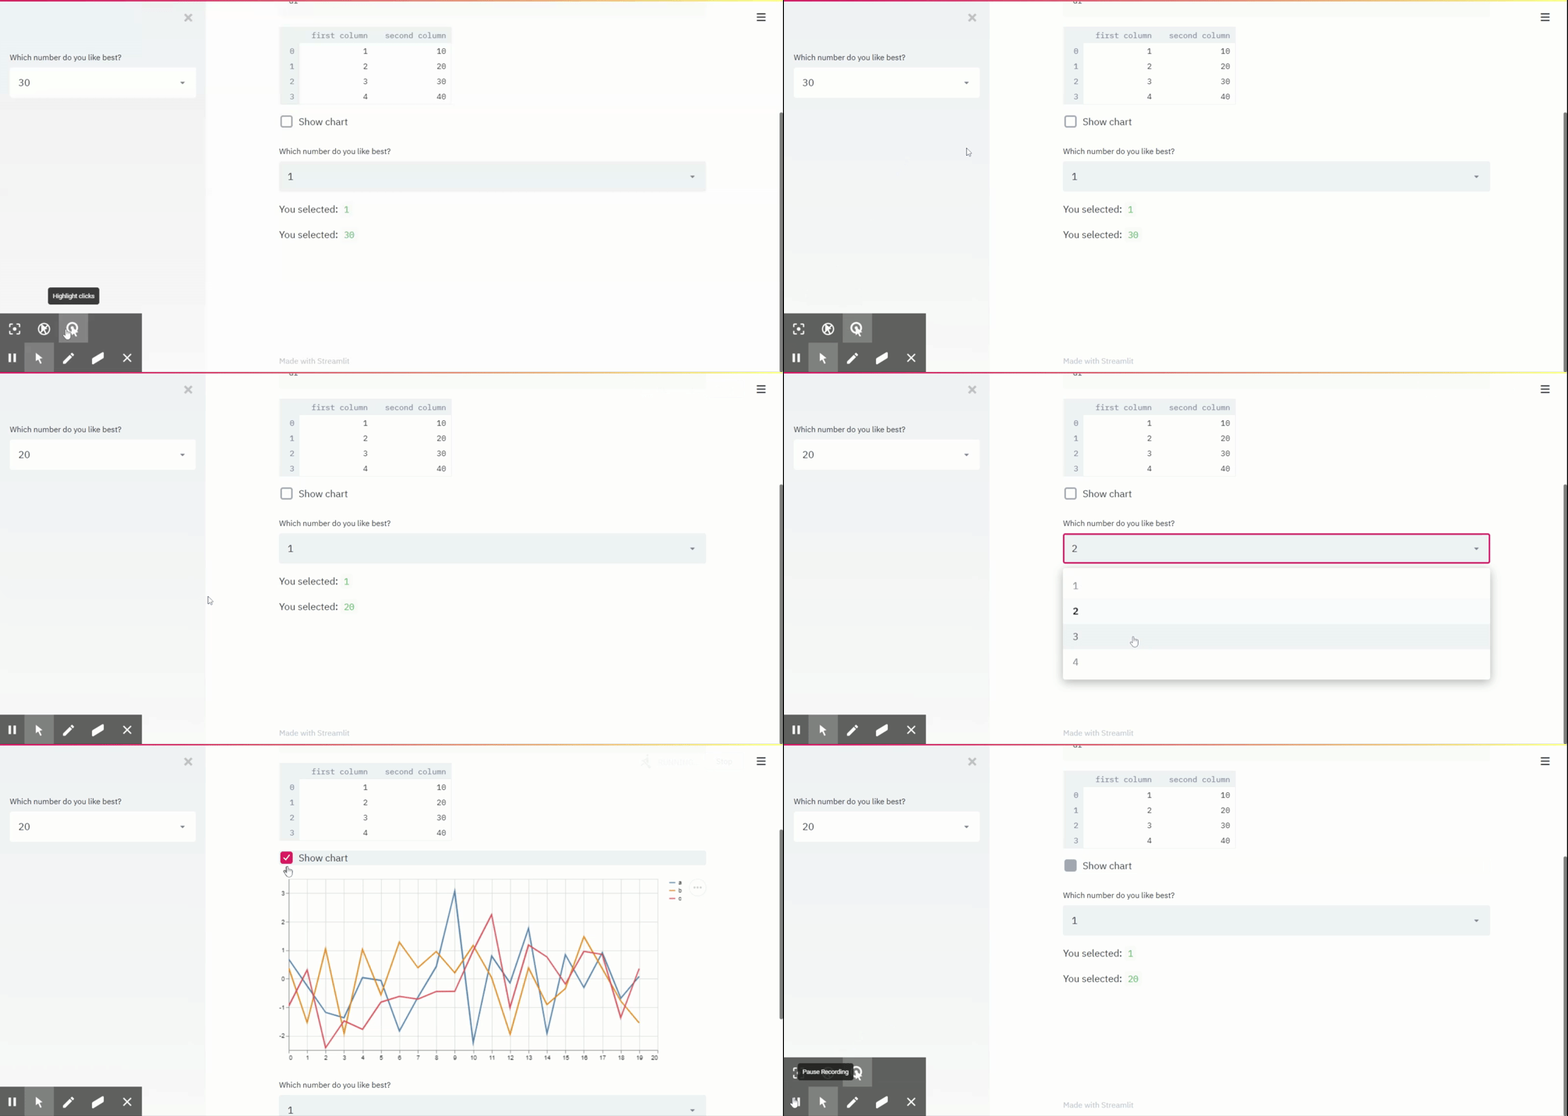
Checkbox/sidebar widgets
# checkboxes
if st.checkbox('Show chart'):
    chart_data = pd.DataFrame(
       np.random.randn(20, 3),
       columns=['a', 'b', 'c'])

    st.line_chart(chart_data)

# selectbox
option = st.selectbox(
    'Which number do you like best?',
     df['first column'])

'You selected: ', option

# sidebar widget
option1 = st.sidebar.selectbox(
    'Which number do you like best?',
     df['second column'])

'You selected:', option1

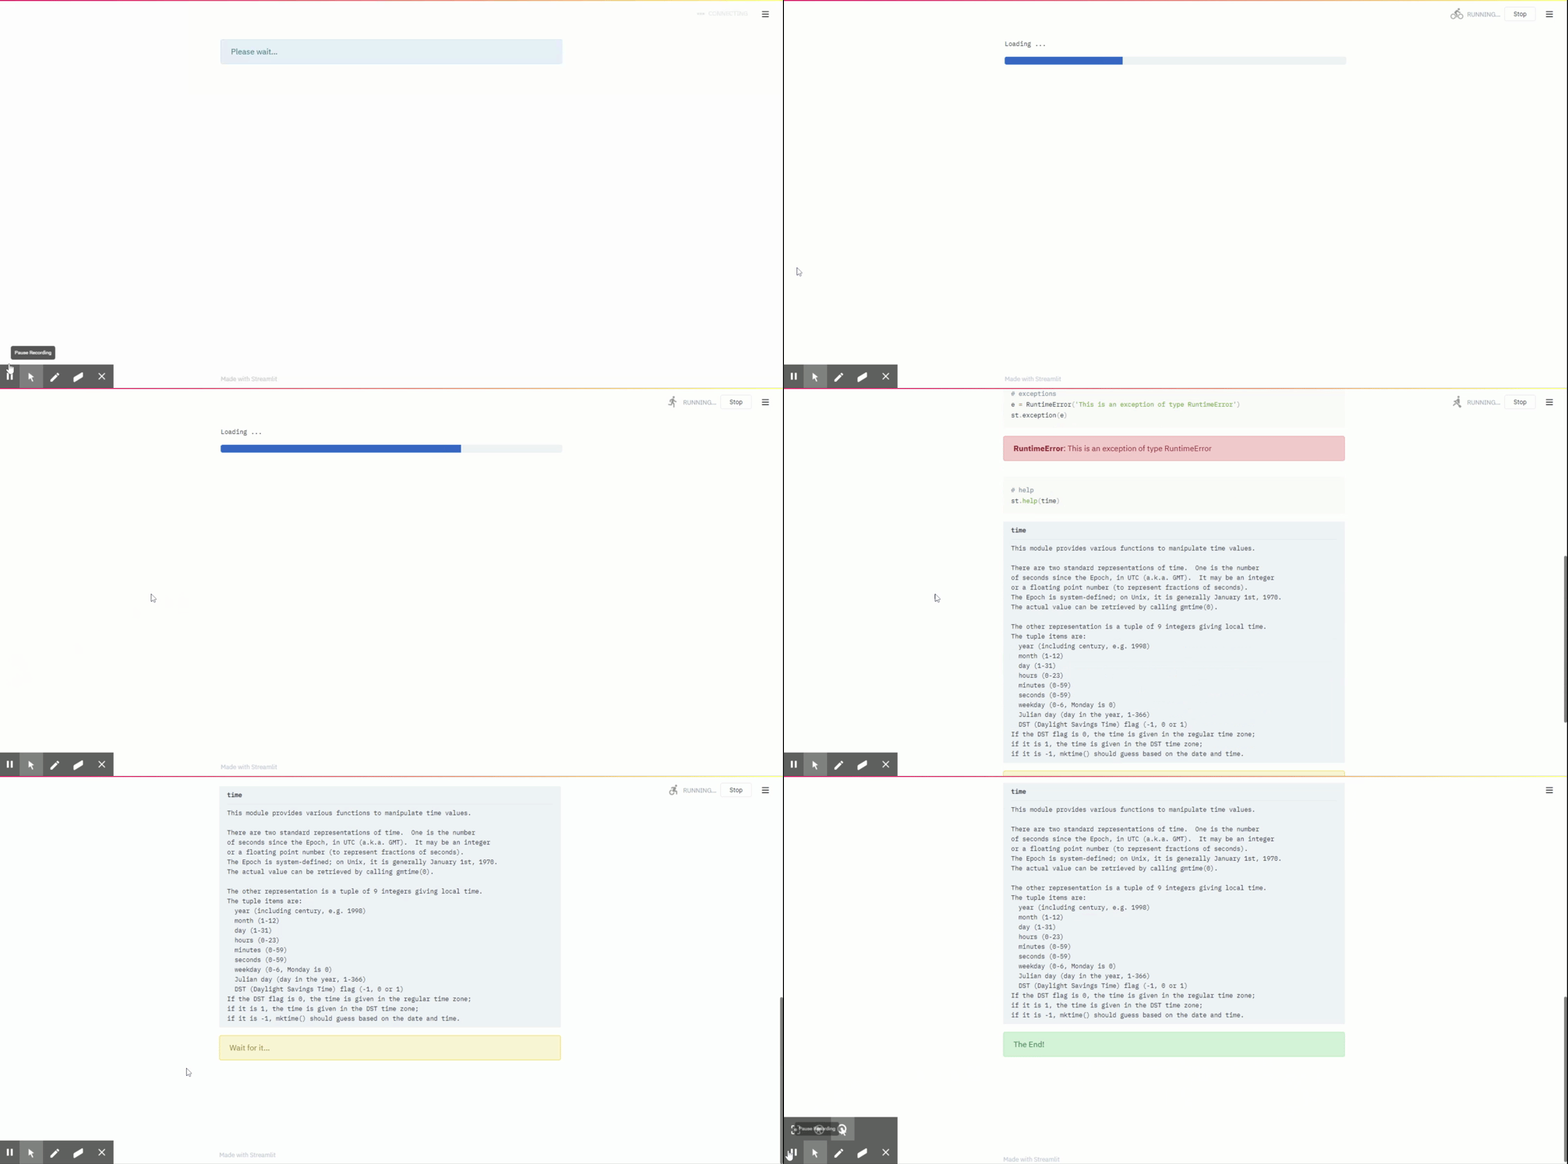
Progress & status
# initialise placeholder
my_placeholder = st.empty()
# assign a value
my_placeholder.text("Loading ...")
# progress bar
my_bar = st.progress(0)

for percent_complete in range(100):
    time.sleep(0.1)
    my_bar.progress(percent_complete + 1)

# update value after some event
my_placeholder.text("Loading completed !")

# error message
st.error('This is an error')

# warnings
st.warning('This is a warning')

# show information
st.info('This is a purely informational message')

# success
st.success('This is a success message!')

# exceptions
e = RuntimeError('This is an exception of type RuntimeError')
st.exception(e)

# help
st.help(time)

# spinner
with st.spinner('Wait for it...'):
    time.sleep(5)
st.success('The End!')

# Balloons
st.balloons()

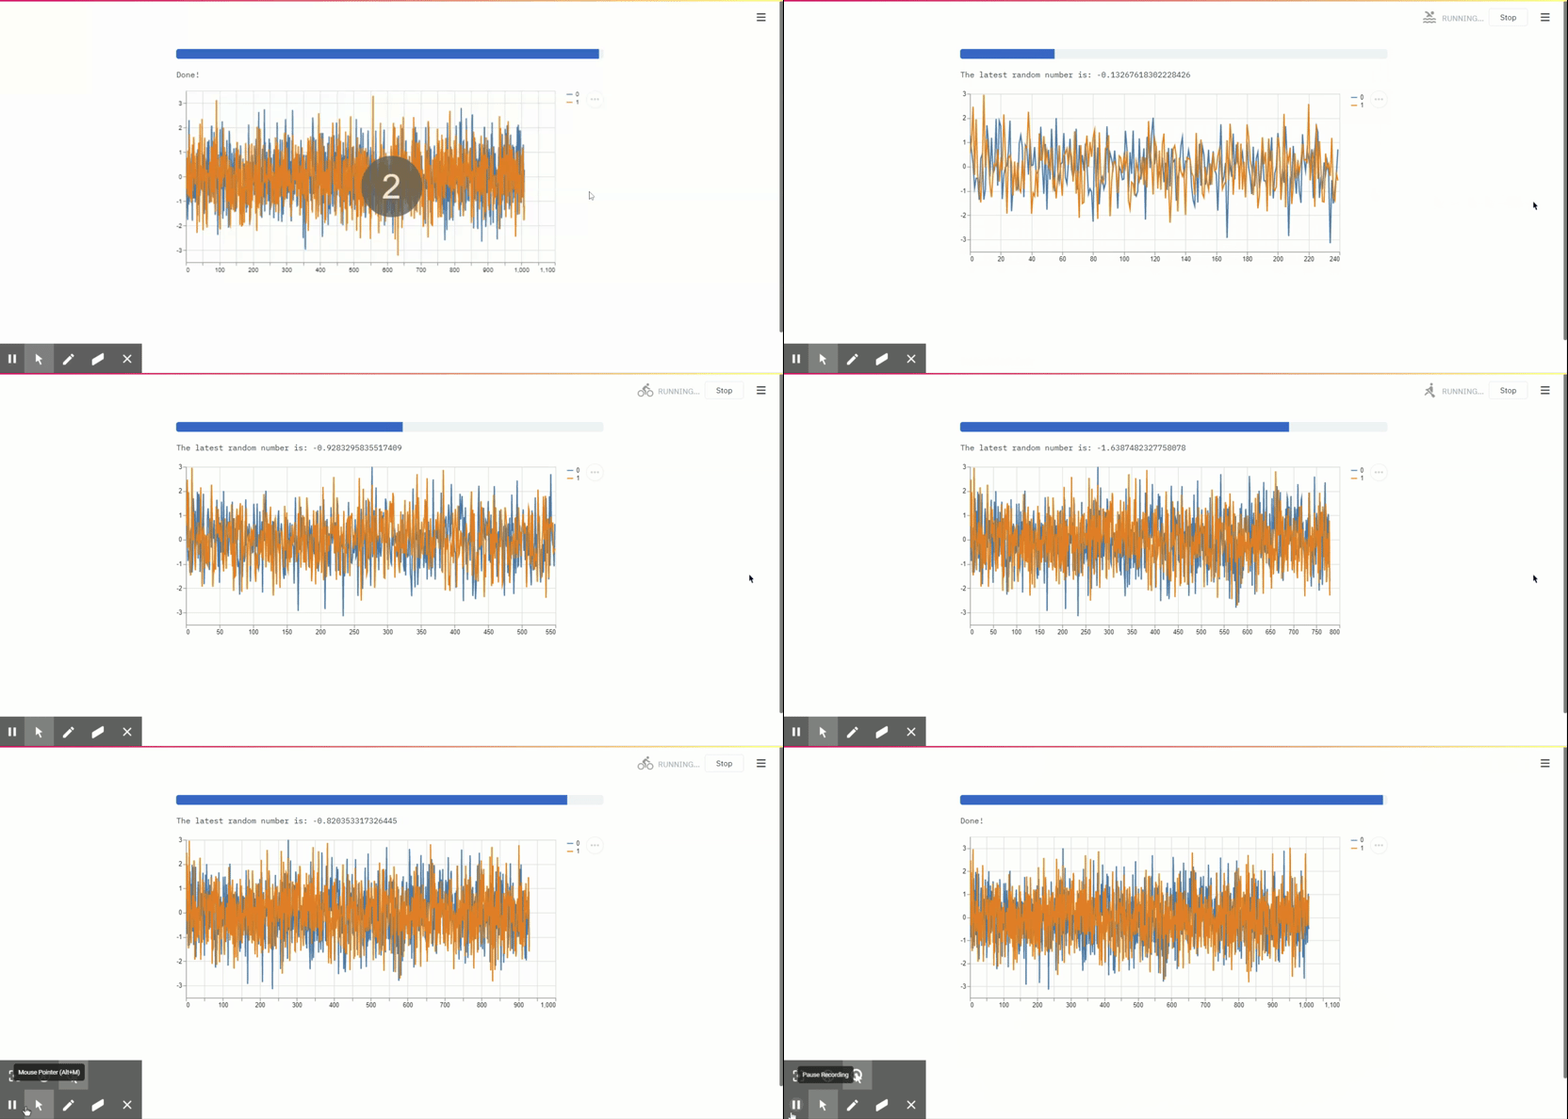
Animation
# animate
progress_bar = st.progress(0)
status_text = st.empty()
chart = st.line_chart(np.random.randn(10, 2))

for i in range(100):
    # Update progress bar.
    progress_bar.progress(i)

    new_rows = np.random.randn(10, 2)

    # Update status text.
    status_text.text(
        'The latest random number is: %s' % new_rows[-1, 1])

    # Append data to the chart.
    chart.add_rows(new_rows)

    # Pretend we're doing some computation that takes time.
    time.sleep(0.1)

status_text.text('Done!')
st.balloons()

Display media
# Image (jpg/png)
image = Image.open('env.jpg')
st.image(image, width=None, use_column_width=False, clamp=False, channels='RGB', format='JPEG', caption='Human & Environment')

# Audio (mp3/wav/ogg)
audio_file = open('bensound-summer.mp3', 'rb')
audio_bytes = audio_file.read()
st.audio(audio_bytes,  format='audio/mp3', start_time=0)

# Video (mp4)
video_file = open('forest.mp4', 'rb')
video_bytes = video_file.read()
st.video(video_bytes, format='video/mp4', start_time=0)
